
TL;DR:
- More money is transferred across borders through personal remittances than through foreign aid and FDI combined. Despite reaching $905 billion in 2024, remittance costs remain high at an average of 6.3%, with digital and local-currency systems reshaping the flow landscape. Understanding regional patterns and choosing cost-effective channels is crucial for families and businesses to maximize the impact of every dollar sent.
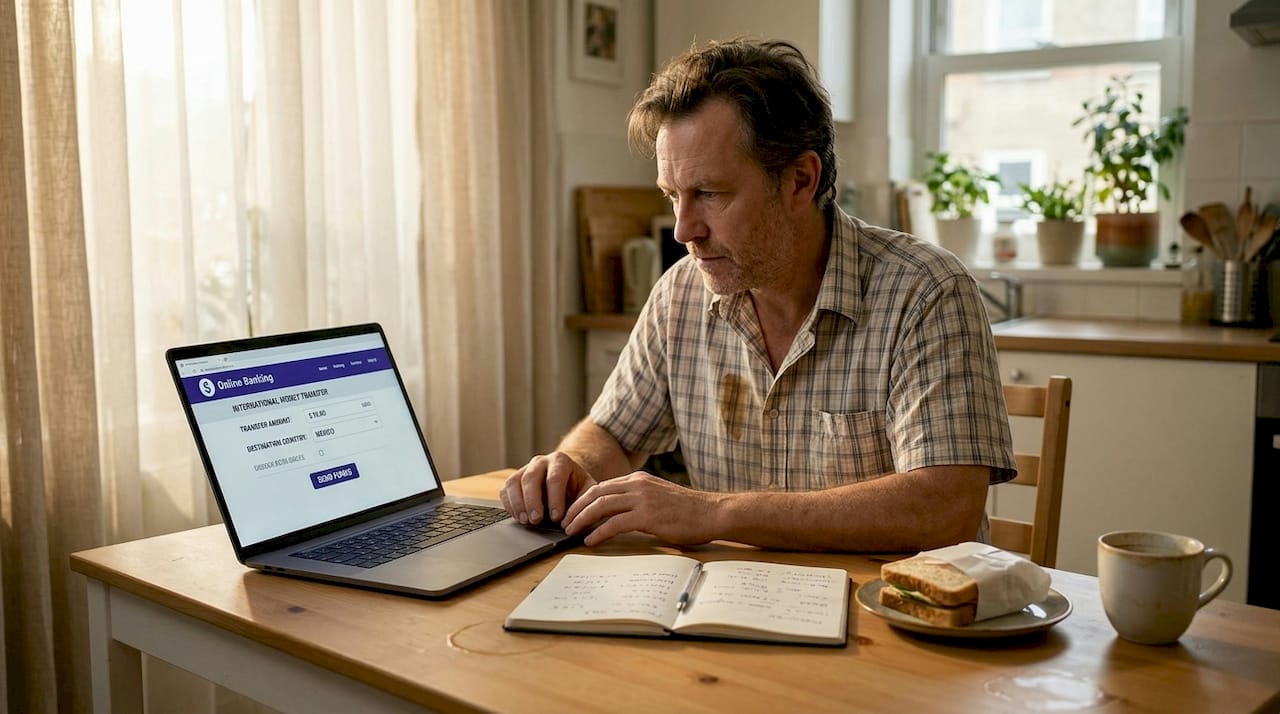
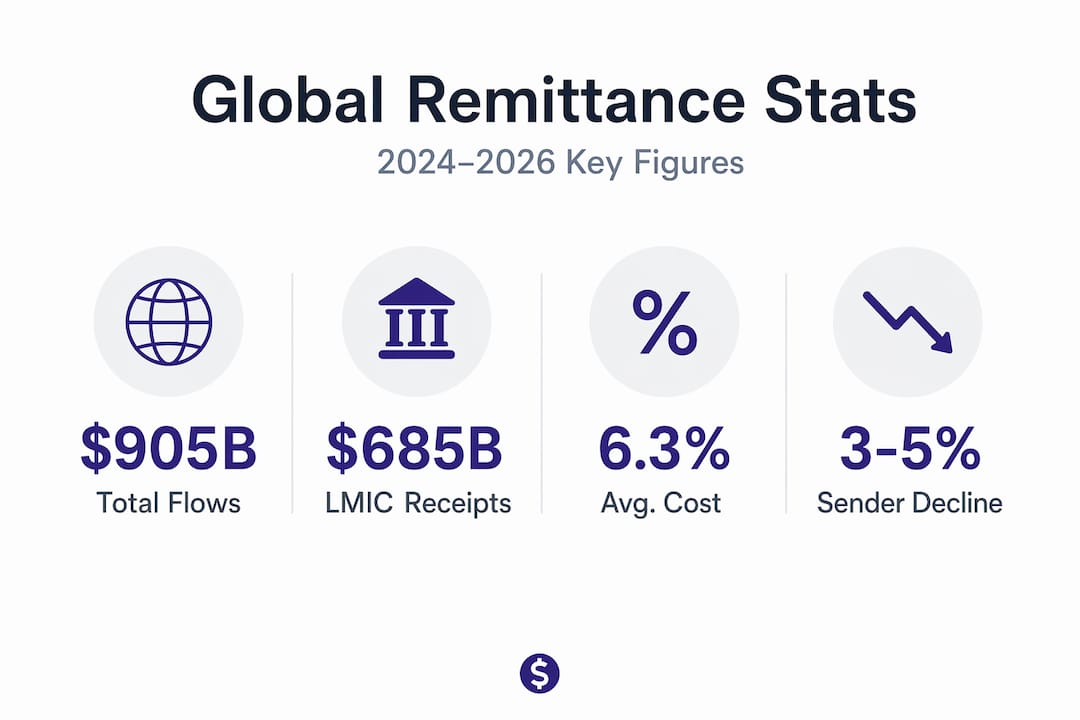
More money moves across borders through personal remittances than through foreign aid and foreign direct investment combined. Understanding global remittance trends is no longer optional for anyone sending money abroad regularly or managing international payouts at scale. The sector has grown from a modest niche into a $905 billion market, yet it still charges senders more than twice the cost target set by the United Nations. That gap between scale and affordability is exactly where the most important decisions get made.
Table of Contents
- Key takeaways
- Understanding global remittance trends: scale and regional patterns
- Breaking down the real cost of sending money
- How new technologies are reshaping remittance infrastructure
- Behavioral and regulatory forces reshaping who sends and how
- My take on where this market is actually heading
- Find the best rate before your next transfer
- FAQ
Key takeaways
| Point | Details |
|---|---|
| Market size keeps growing | Global remittance flows reached $905 billion in 2024, with $685 billion going to lower-income countries. |
| Costs remain stubbornly high | The average cost to send $200 sits at 6.3%, more than double the 3% UN target. |
| Channel choice drives savings | Banks charge nearly 15% on average; mobile operators average 4.6%, making channel selection critical. |
| Technology is reshaping flows | Blockchain partnerships and local-currency settlement systems are cutting settlement times and improving transparency. |
| Regulation is shifting behavior | New taxes and bank de-risking are pushing senders toward digital and sometimes informal channels. |
Understanding global remittance trends: scale and regional patterns
The headline number tells one story. Remittances reaching $905 billion in 2024 is remarkable, but the $685 billion flowing specifically to low- and middle-income countries is where the real human impact lives. For many households in sub-Saharan Africa, South Asia, and Latin America, these transfers represent a larger and more reliable income source than anything their national government or foreign donors provide.
Regional patterns matter enormously when you analyze remittance flow patterns. Consider these corridors:
- Latin America: Mexico remains one of the world's top remittance-receiving nations, driven largely by the US-Mexico corridor. Flows to the region held up strongly through 2024 and into 2025, partly because the US labor market stayed tight.
- Southeast Asia: The Philippines is a textbook case. Philippine remittances grew just 2.3% year over year in March 2026, the slowest pace since mid-2023, reflecting both migration slowdowns and a shift toward informal and digital channels.
- North Africa and South Asia: Countries like Morocco, Pakistan, and Bangladesh rely on remittances for a significant share of GDP, making any cost reduction at the sender end a direct economic policy lever.
The broader growth story is also complicated by migration dynamics. A decline in active remitters of 3% to 5% is projected due to reduced migration flows and deportations in major sender countries. Some of that volume loss is being offset by senders increasing their transaction frequency, but the net picture for 2026 remittance trends is one of resilience under pressure rather than easy expansion.
Pro Tip: When you read aggregate remittance statistics, remember that macro data often understates actual flows because informal and cash channels are systematically undercounted. The real impact on families is larger than official numbers suggest.
Breaking down the real cost of sending money
Cost is where many senders get blindsided. The average cost to send $200 globally sits at 6.3% as of Q3 2025. That is more than double the 3% target set under the UN Sustainable Development Goals. For a worker sending $400 a month to family abroad, that gap translates to real money lost every single transfer.
The cost breakdown by channel reveals how much your choice of provider actually matters:
| Channel | Average cost (sending $200) |
|---|---|
| Banks | 14.9% |
| Post offices | 5.5% |
| Money transfer operators | 4.7% |
| Mobile operators | 4.6% |
Banks are the most expensive option by a wide margin. Part of that cost comes from the correspondent banking chain, where multiple intermediary banks each take a cut before money reaches its destination. Add compliance costs and currency conversion margins, and the total easily exceeds 10% for many corridors.

What makes this especially frustrating is that the published fee is rarely the whole story. FX spread, the gap between the mid-market exchange rate and what you actually get, can add another 1% to 4% on top of the stated transfer fee. For frequent senders, ignoring FX spreads and focusing only on headline fees means consistently overpaying.
Pro Tip: Always calculate total cost by comparing the amount your recipient actually receives against the mid-market exchange rate. Use a tool that shows you both the fee and the FX rate in one view. That is the only number that matters.
The alternatives to bank transfers are where most of the cost savings actually live. Mobile operators and specialized money transfer operators consistently outperform banks on both speed and affordability.
How new technologies are reshaping remittance infrastructure
The most consequential shift happening right now in remittance market analysis is the move away from dollar-dominated correspondent banking toward local-currency settlement systems. This is not just a fintech story. It is a structural change in how cross-border value moves.
Here is how the main technological forces break down:
-
Local-currency settlement platforms. China's CIPS network now counts 1,700 participants across 190 countries, with daily volume exceeding $179.7 billion. Its local-currency share has risen to 53%, reducing FX conversion costs for participating corridors. Meanwhile, the Nexus multi-country instant payment platform allows retail transfers to settle in seconds without touching a correspondent bank.
-
Blockchain and stablecoin rails. MoneyGram partnered with Tempo to integrate blockchain settlement for real-time, transparent remittance processing. Stablecoins reduce the volatility risk that made crypto impractical for everyday transfers, and the partnership model lets traditional operators plug into new infrastructure without rebuilding from scratch.
-
Harmonized regional payment standards. Europe's SEPA instant payment infrastructure is the clearest model of how standardized rails within a currency zone can dramatically cut costs and delays. SEPA's instant payment mandate shows that regulatory harmonization, not just technology, is necessary to unlock the full cost benefit.
-
Digital wallet and aggregator platforms. The growth of remittance aggregators means senders can access multiple payment rails through a single interface, automatically routing to the cheapest or fastest option for a given corridor.
The catch with local-currency systems is fragmentation. More bilateral or regional networks mean more moving parts for businesses managing payouts across multiple corridors. Local-currency cross-border systems reduce FX risk and costs but create a patchwork of standards rather than a single global solution.
Pro Tip: If you are running cross-border payout programs for a business, map each corridor individually. The optimal rail for US-to-Mexico transfers is likely different from US-to-Philippines or Europe-to-Morocco. One-size-fits-all provider choices usually mean overpaying on at least half your corridors.
Behavioral and regulatory forces reshaping who sends and how
Technology does not operate in a vacuum. Sender behavior is being shaped just as much by regulation and economics as by the apps available on their phones.
The clearest example from 2026 remittance trends is the US federal 1% tax on physical cash remittances, which took effect in 2026. This tax applies to cash transfers specifically, creating a direct financial incentive to switch to digital channels. For corridors like US-to-Mexico and US-to-Central America, where cash agents historically dominated, this policy is accelerating a channel migration that was already underway.
Several other forces are shaping remittance behavior simultaneously:
- Bank de-risking. The number of active correspondent banks dropped by over 20% between 2011 and 2019. Banks exited smaller corridors to reduce compliance exposure, leaving gaps that often push senders toward unregulated operators.
- Frequency shifts. As the number of senders declines slightly, the senders who remain are sending more often. Smaller, more frequent transfers are a pattern linked to digital channel adoption and improved speed.
- Informal channel risk. When licensed channels are too expensive or unavailable, senders turn to unlicensed operators. Channel switching behavior in response to taxes and fees shows how quickly the market fragments when regulated options fail on cost or access.
- Digital adoption acceleration. Mobile money is no longer just a developing-market workaround. It is now the fastest-growing channel across most major corridors, driven by smartphone penetration and operator competition.
The Philippines illustrates all these dynamics at once. Slower remittance growth, a shift toward digital channels, and increased pressure from informal operators are all happening together. For the future of global remittances, the Philippines corridor is a leading indicator worth watching closely.
My take on where this market is actually heading
I have spent years looking at how money moves between countries, and the thing that strikes me most is how the narrative of progress keeps outrunning the reality for the people actually paying these fees. We talk about blockchain, stablecoins, and instant settlement like they are already the default. For most senders in the world, they are not.
What I have found genuinely useful for both individuals and businesses is a simple reframe. Stop asking "which provider has the lowest fee?" and start asking "which provider delivers the most to my recipient per dollar I spend?" Those are different questions, and they give different answers once you account for hidden FX costs.
I am also skeptical of the idea that one dominant payment rail will emerge and solve everything. A diversified system of payment rails, including digital wallets, stablecoins, and yes, even traditional networks, is more resilient than any single solution. The SEPA model is instructive, but it took decades and a common currency to get there. Global remittances serve dozens of currencies and regulatory regimes.
For businesses building cross-border payout programs, my practical advice is to treat each corridor as its own cost center with its own compliance requirements. The businesses I have seen struggle are the ones that apply a single global solution to a problem that demands local precision. Map your corridors, compare your total costs, and build in flexibility for the regulatory shifts that will absolutely keep coming.
Digital and traditional systems will coexist for a long time. The opportunity is in knowing which tool to use for which job.
— Brahim
Find the best rate before your next transfer

Knowing how remittance markets work is useful. Applying that knowledge to your next transfer is where it actually saves you money. Idealremit compares live rates, fees, and exchange rates from trusted providers across more than 100 countries, so you can see the total cost of each option before you commit. Whether you are sending to Morocco, the Philippines, Mexico, or anywhere else, the difference between the best and worst provider on a given corridor can easily exceed 5%. Use Idealremit's comparison tool to find the most cost-effective provider for your specific corridor right now, and set up a rate alert so you never miss a favorable window.
FAQ
What is the current average cost to send $200 internationally?
As of Q3 2025, the global average cost to send $200 is 6.3%, more than double the UN SDG target of 3%. Banks are the most expensive channel at 14.9%, while mobile operators average 4.6%.
How large are global remittance flows today?
Global remittance flows reached an estimated $905 billion in 2024, with $685 billion directed to low- and middle-income countries, surpassing both foreign aid and foreign direct investment combined.
Why are remittance costs still so high despite new technology?
Correspondent banking fees, compliance costs, and FX spreads continue to inflate total costs. Bank de-risking has also reduced coverage in smaller corridors, limiting competitive pressure that would otherwise drive prices down.
How does the US 1% remittance tax affect senders?
The US federal 1% tax on physical cash remittances, which took effect in 2026, adds direct cost pressure on cash transfers and is accelerating the shift toward digital channels in major corridors like US-to-Mexico.
What is the best channel for affordable international money transfers?
Mobile operators and specialist money transfer operators consistently offer the lowest average costs. Comparing total cost, including the FX rate and all fees, across providers for your specific corridor is the most reliable way to find the best option.